 Canopy
Every acre,
seen clearly.
Chlorophyll stress mapped to the individual acre. Irrigation leaks spotted from four hundred miles up. Yield forecasts delivered before the combine leaves the shed.
What the satellite
caught first.
Click any field capture to see the full story — the anomaly the satellite detected, the action the grower took, and what it meant in dollars and bushels.
Corn · Iowa
340 acres
Soybeans · Nebraska
847 acres
Winter Wheat · Kansas
14,200 acres
Soybeans · Illinois
620 acres
Summer 2025
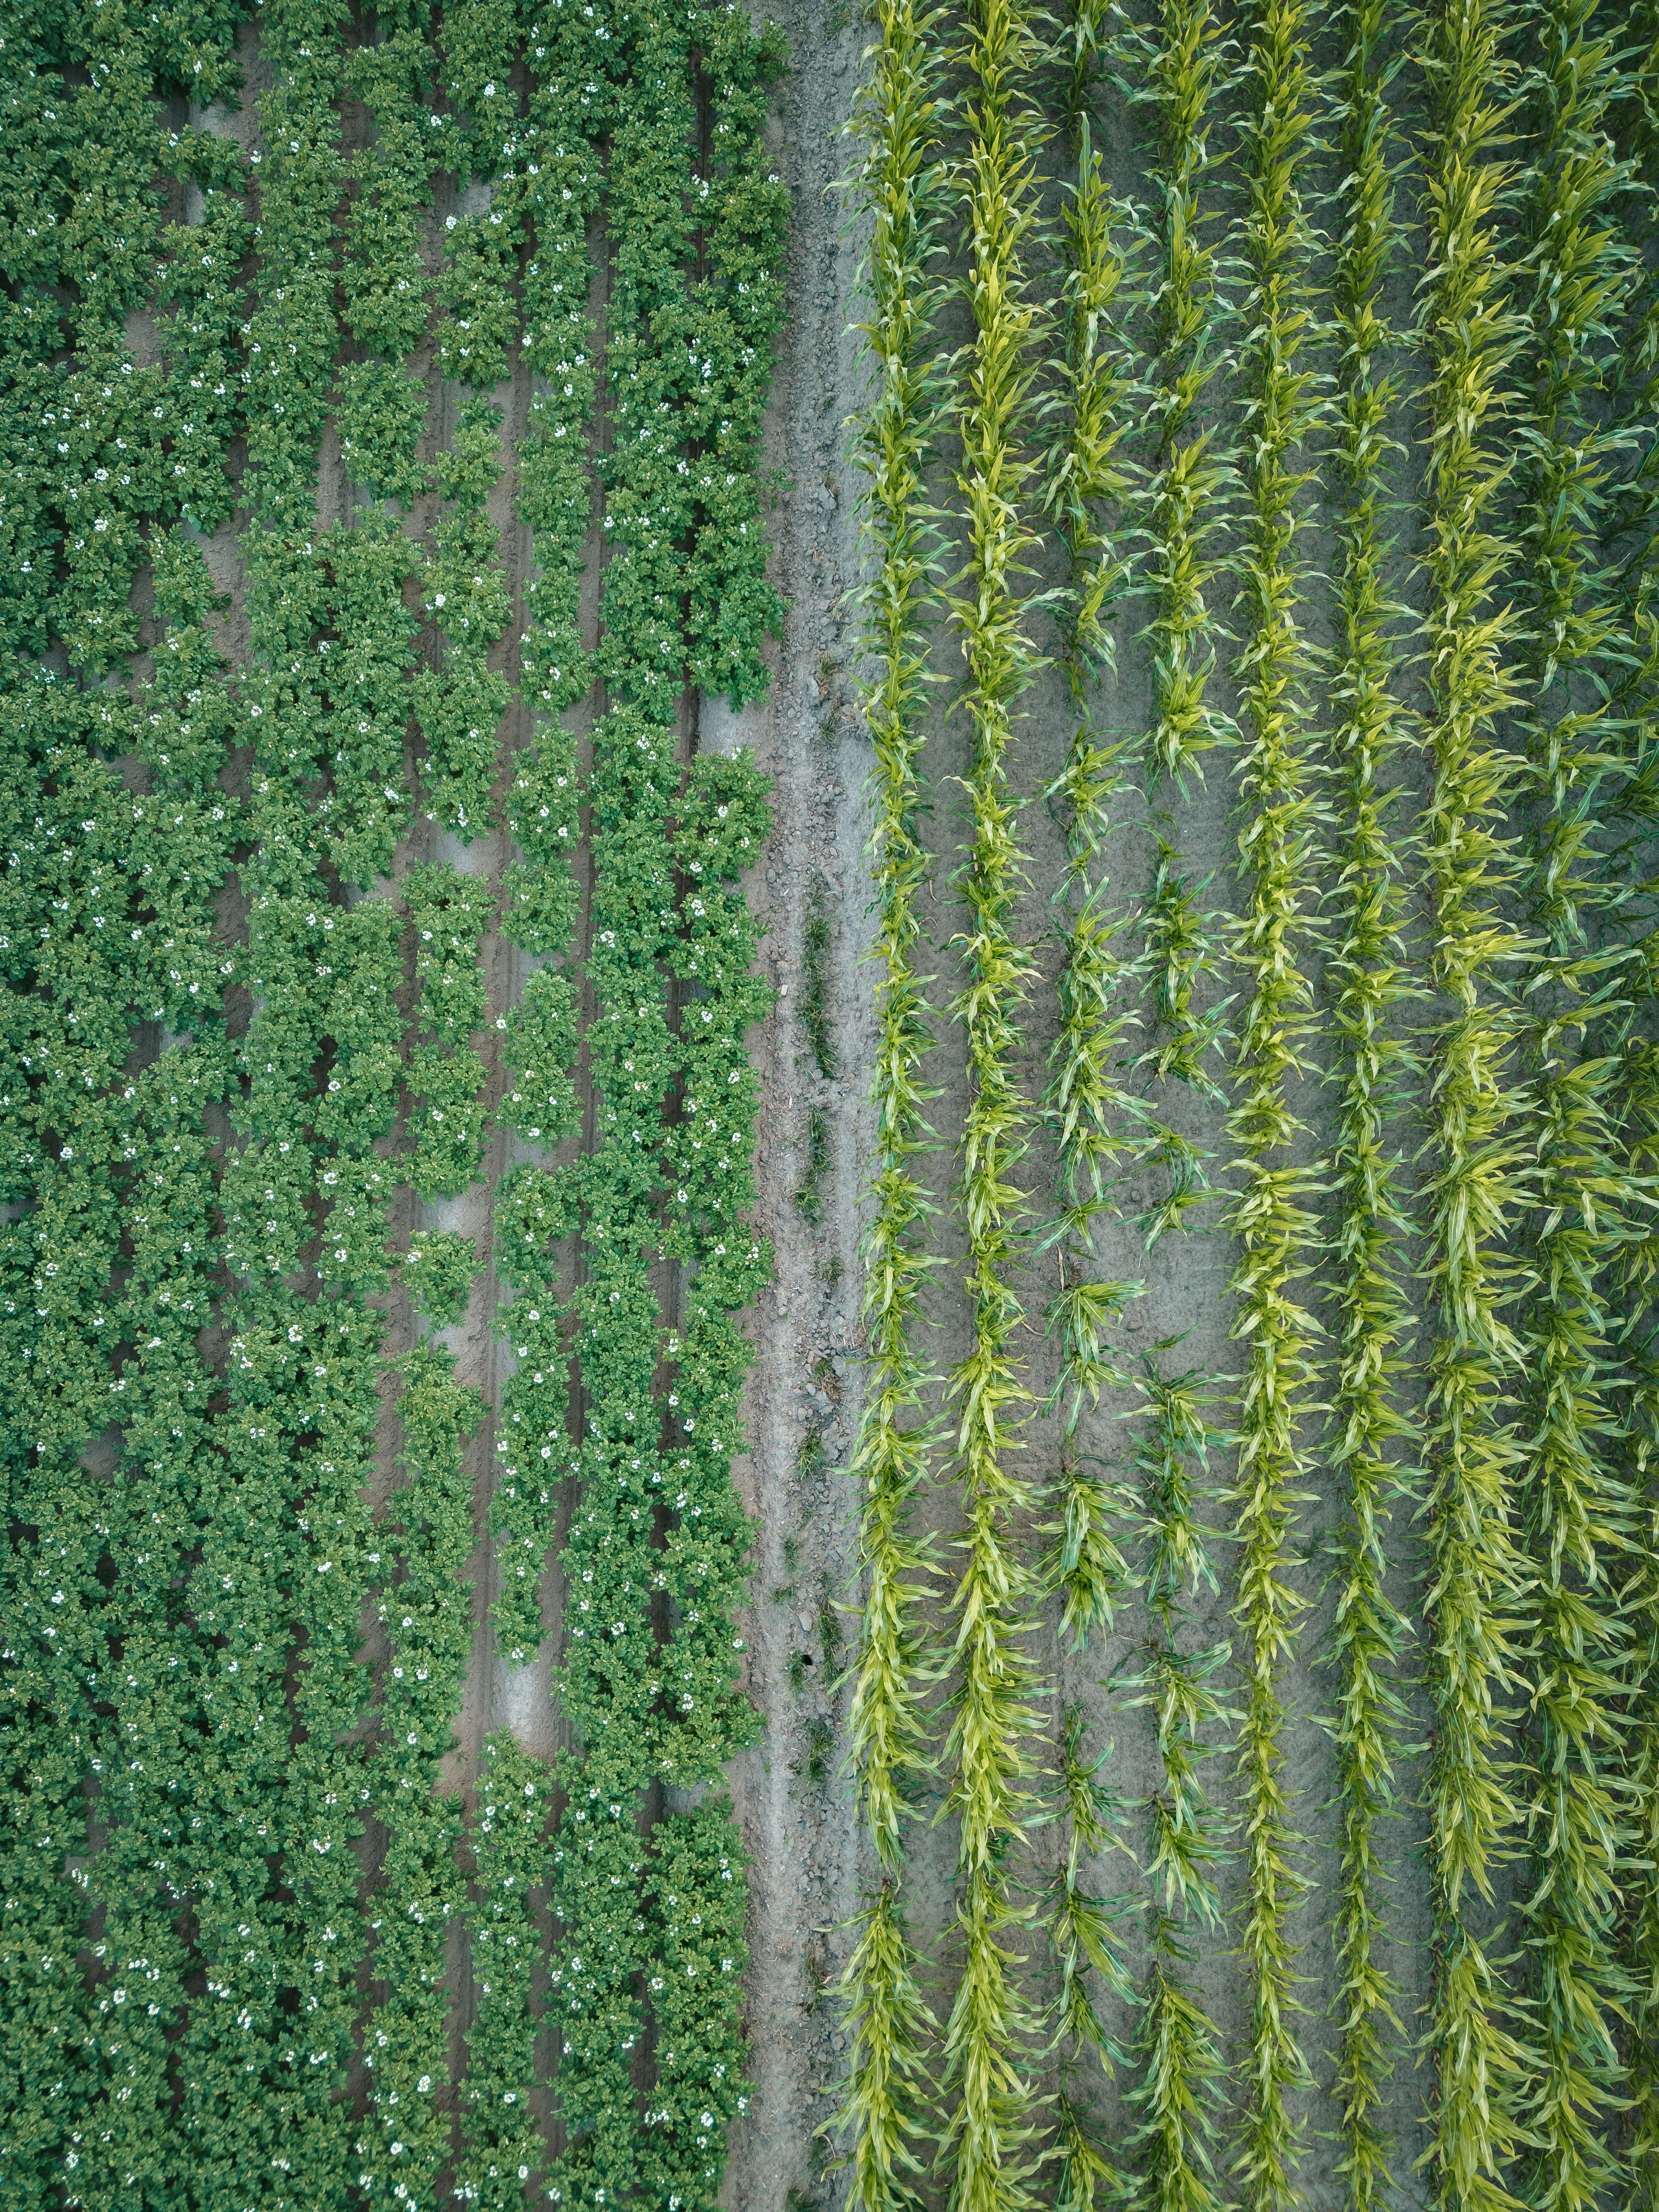
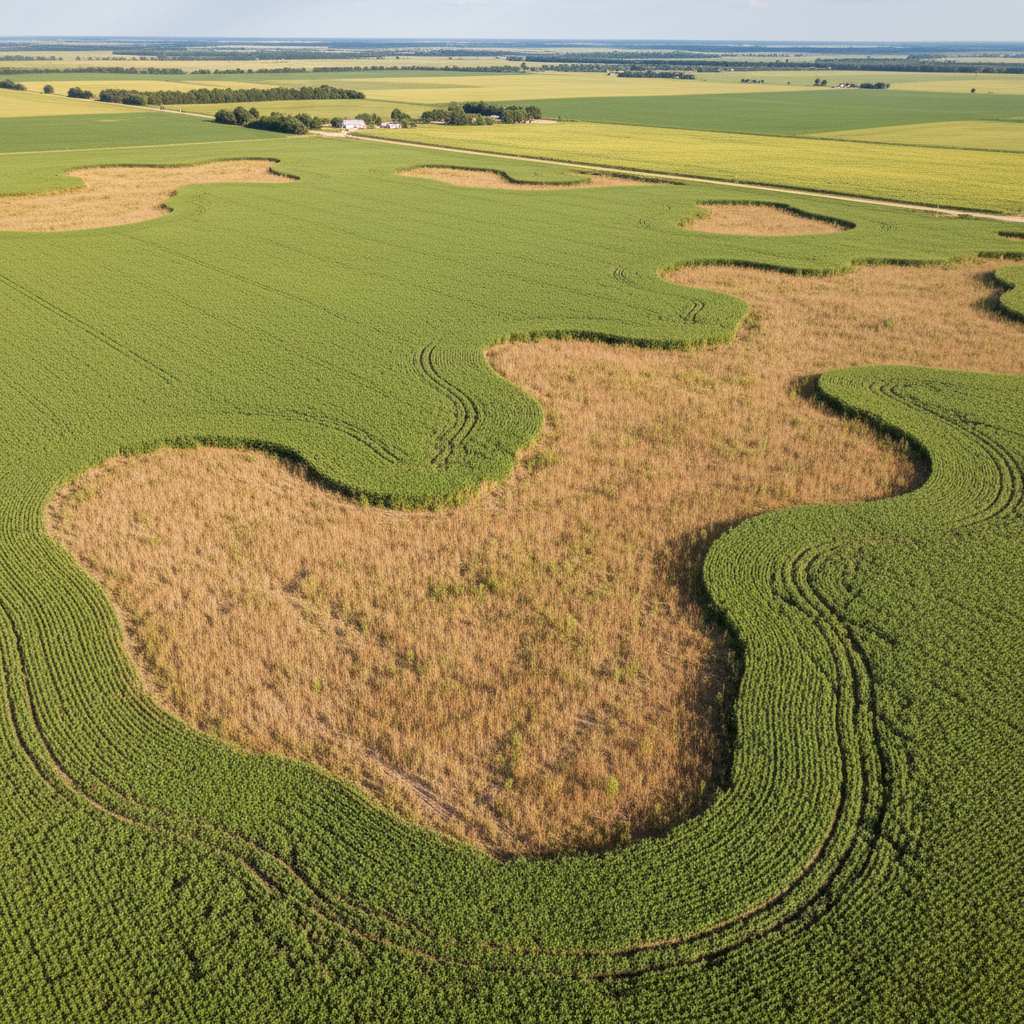
Corn · Iowa
Cause — What the satellite saw
NDVI imagery on July 14th flagged a 340-acre pale band across Field 7N — chlorophyll index 0.31 against a field average of 0.68.
Movement — What the grower did
Operations manager dispatched a soil probe team the following morning. Compaction layer at 14 inches was blocking root elongation in the affected zone.
Result
94,000
dollars saved
Early Summer 2025
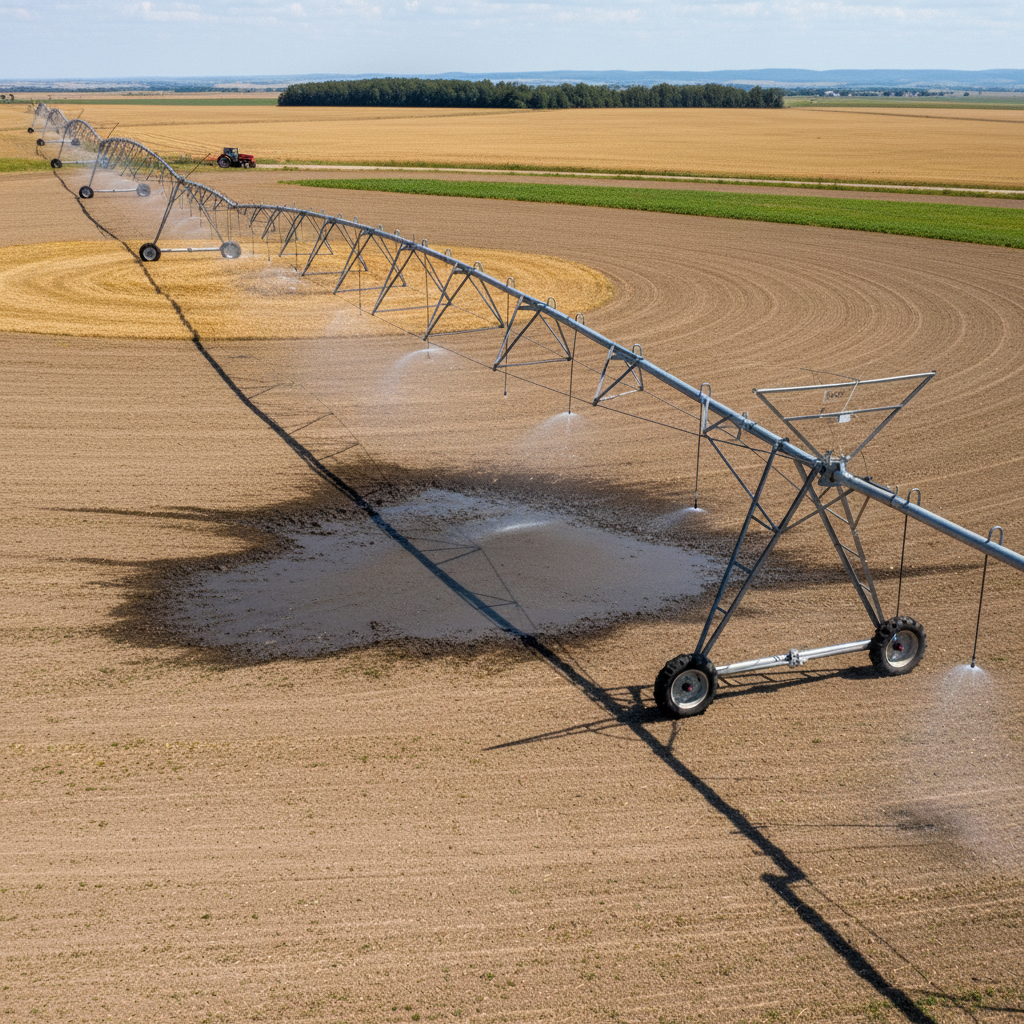
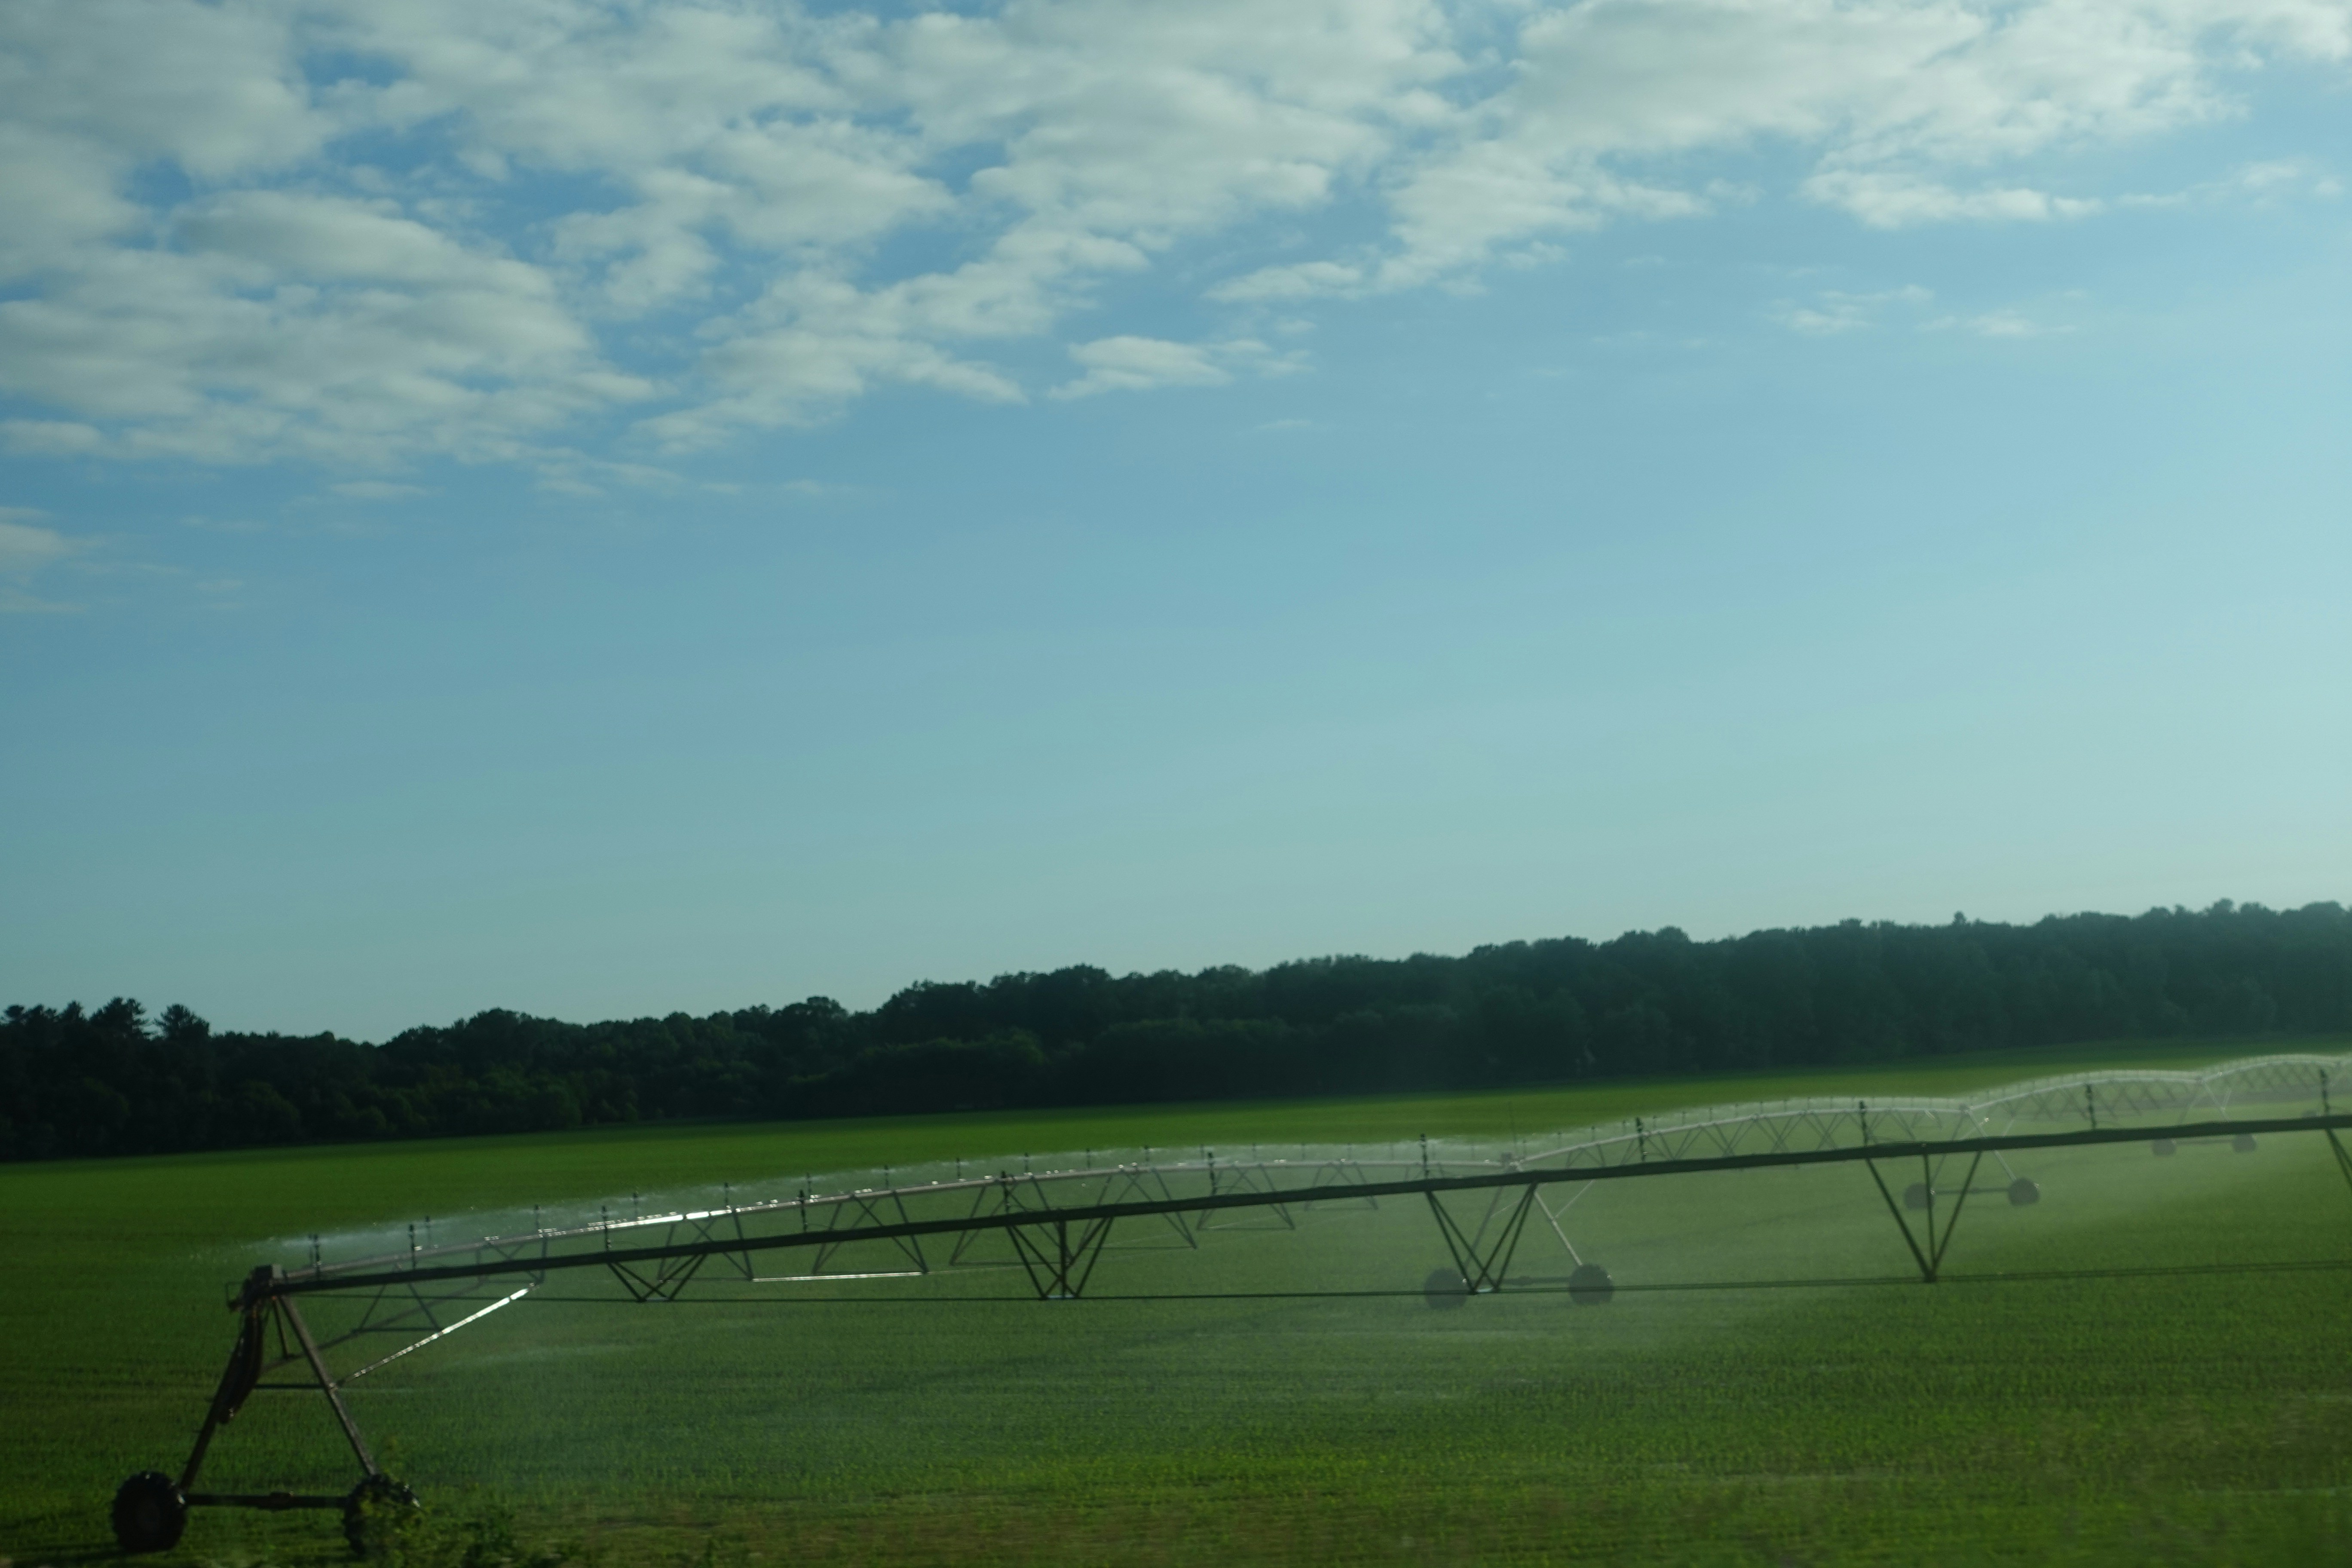
Soybeans · Nebraska
Cause — What the satellite saw
Thermal band analysis showed a 12-acre saturated anomaly beneath Pivot 3, inconsistent with scheduled irrigation. Leak flagged at 4:22 AM — before first light.
Movement — What the grower did
Maintenance crew reached the pivot by 7 AM. A cracked end-gun seal was flushing 190 gallons per minute into a drainage tile.
Result
$47,200
in water & crop loss avoided
Spring 2025
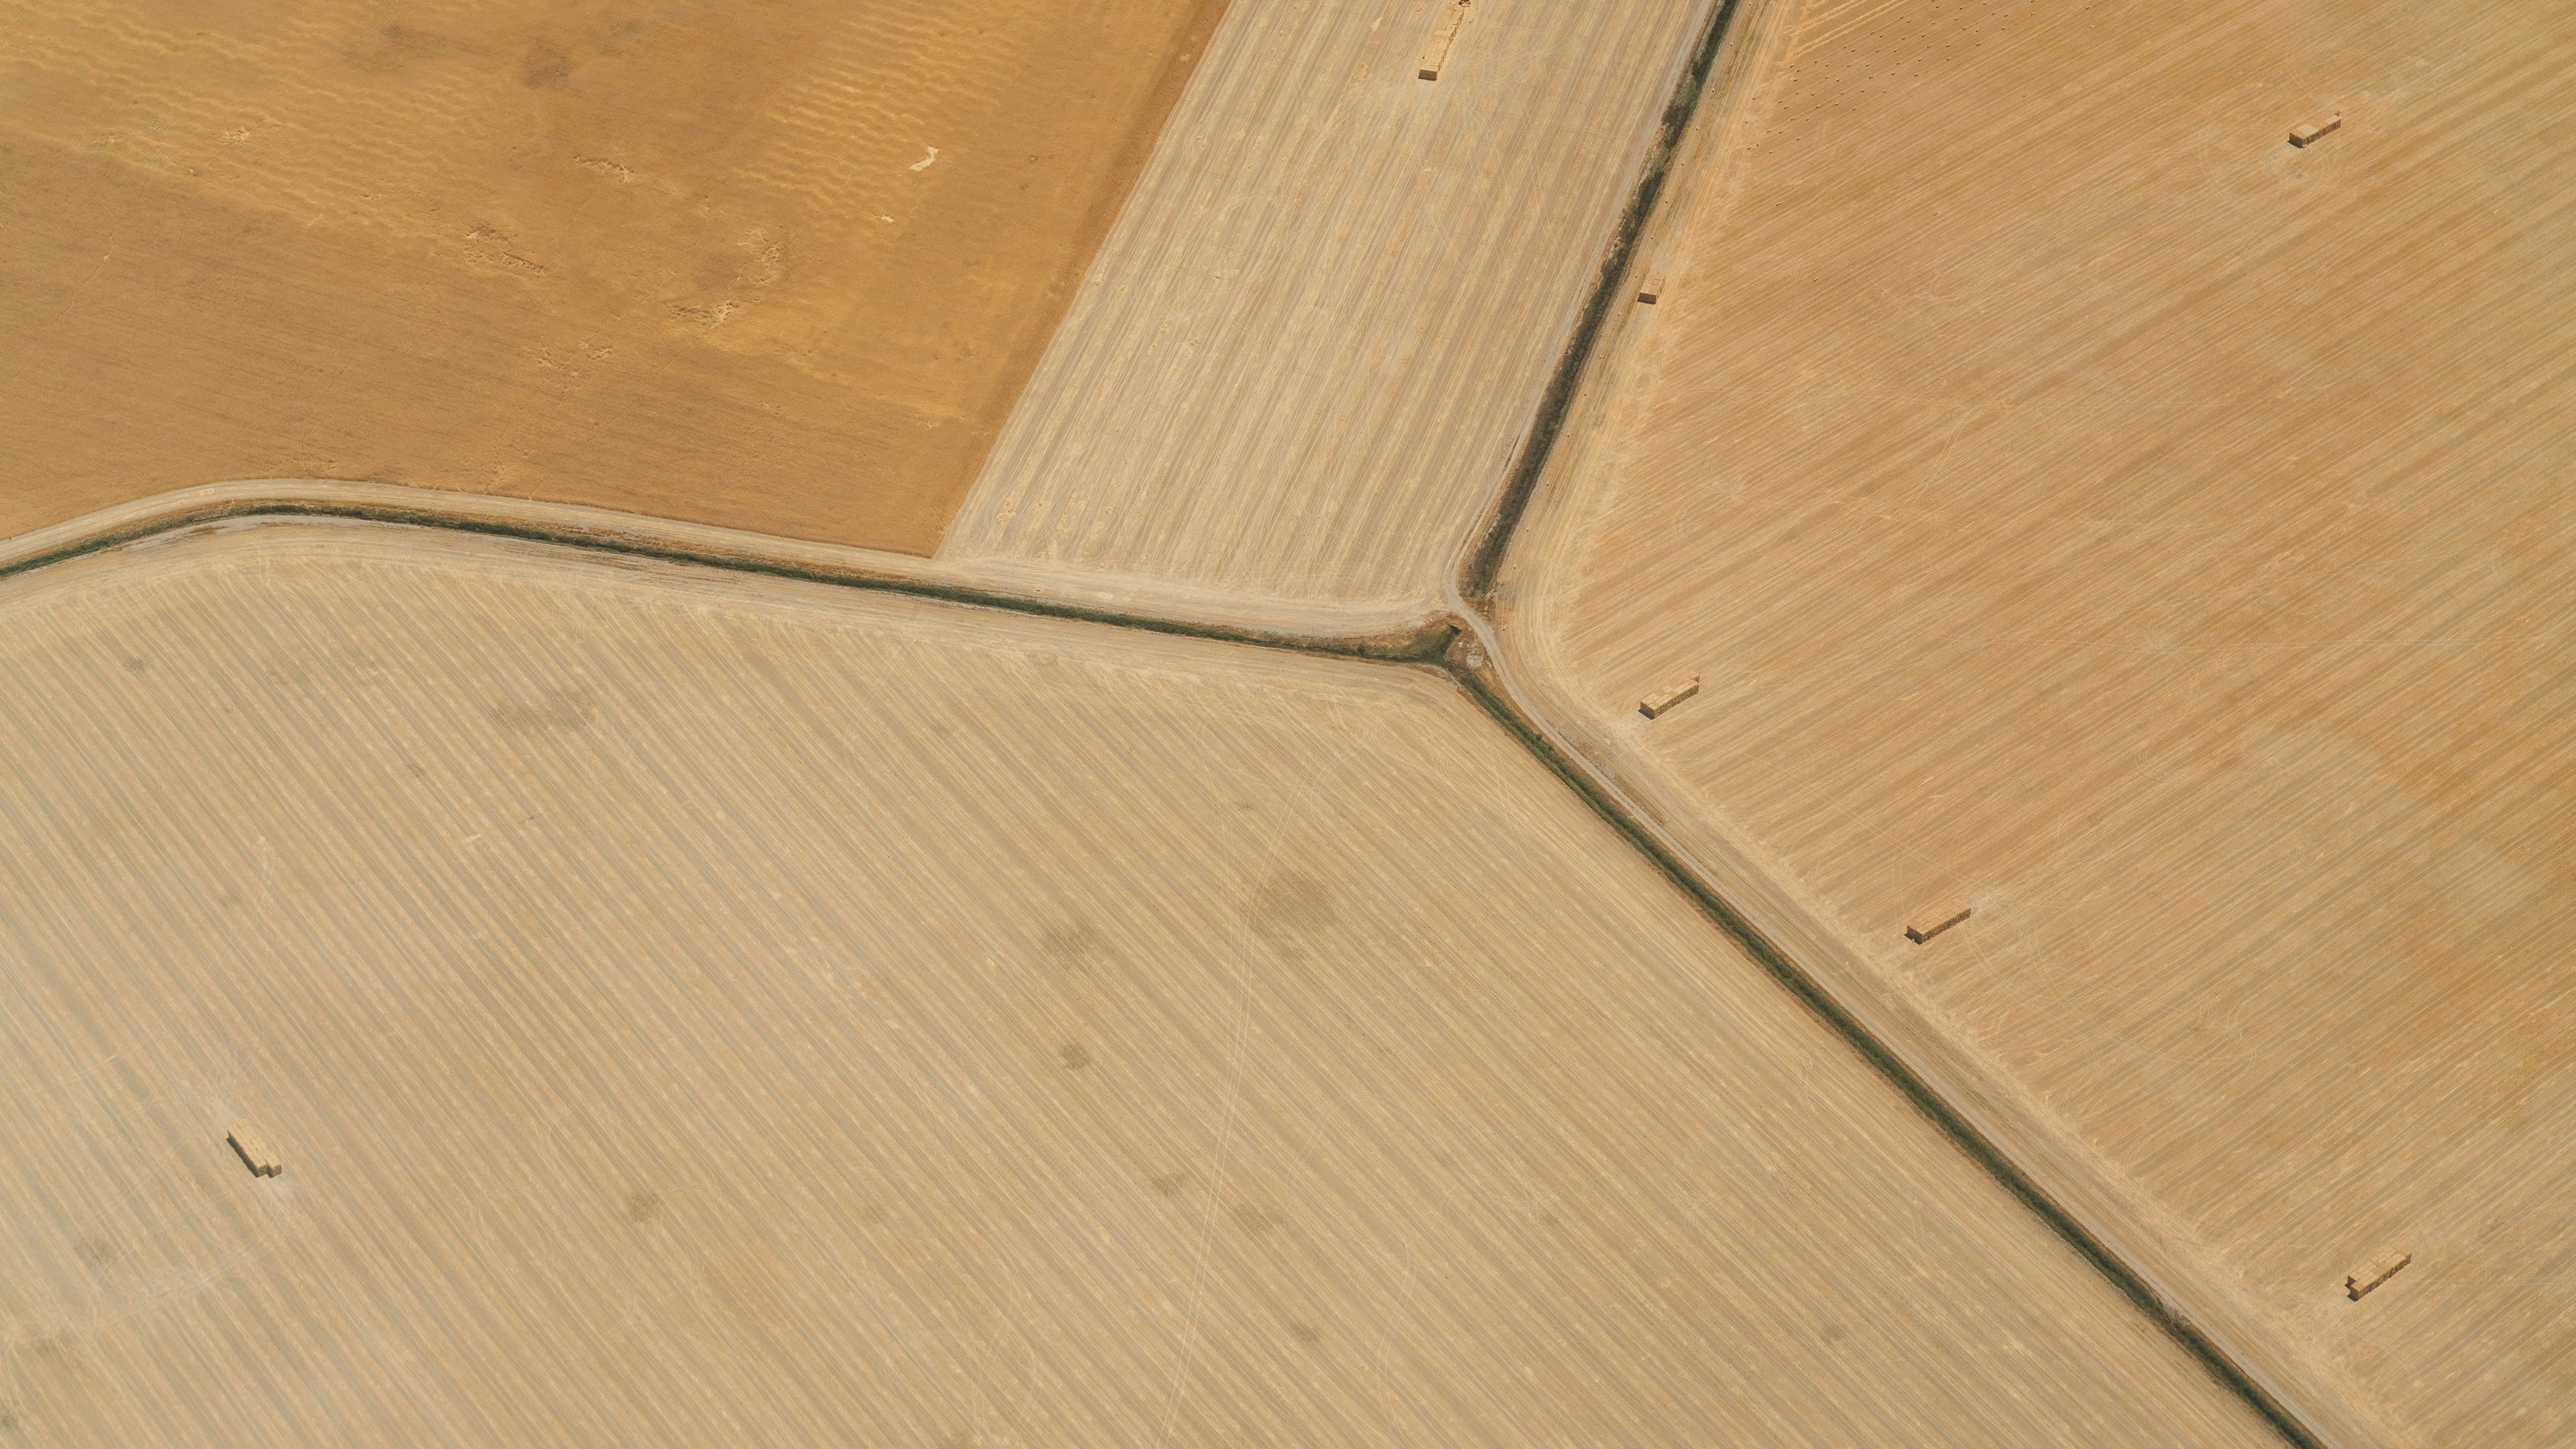
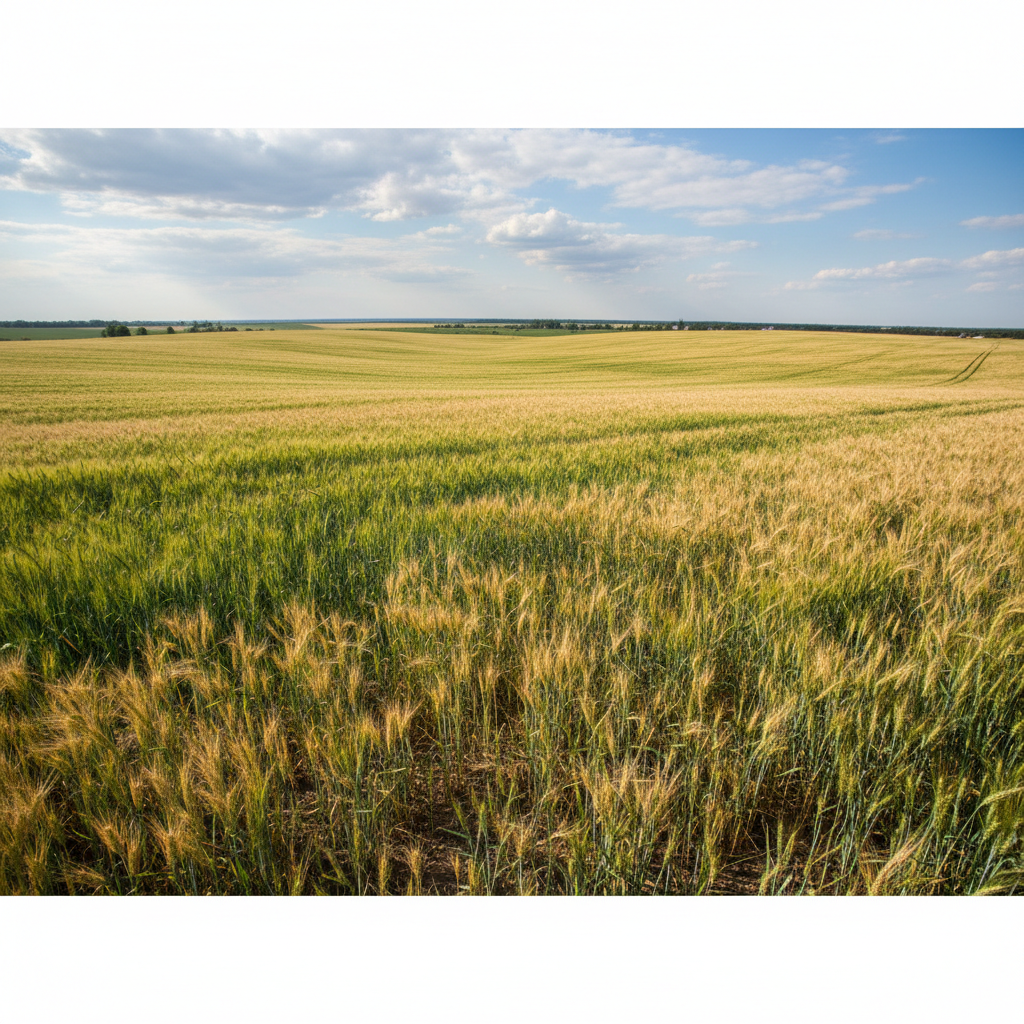
Winter Wheat · Kansas
Cause — What the satellite saw
Multi-spectral composite across 14 grower accounts showed 38% of monitored acreage entering critical moisture deficit — 18 days before county extension issued advisory.
Movement — What the grower did
Cooperative board reallocated $2.1M in emergency irrigation infrastructure budget. Six growers shifted to drought-tolerant variety on 4,200 acres of late-planted ground.
Result
$2.1M
in co-op budget reallocated in time
Late Summer 2024
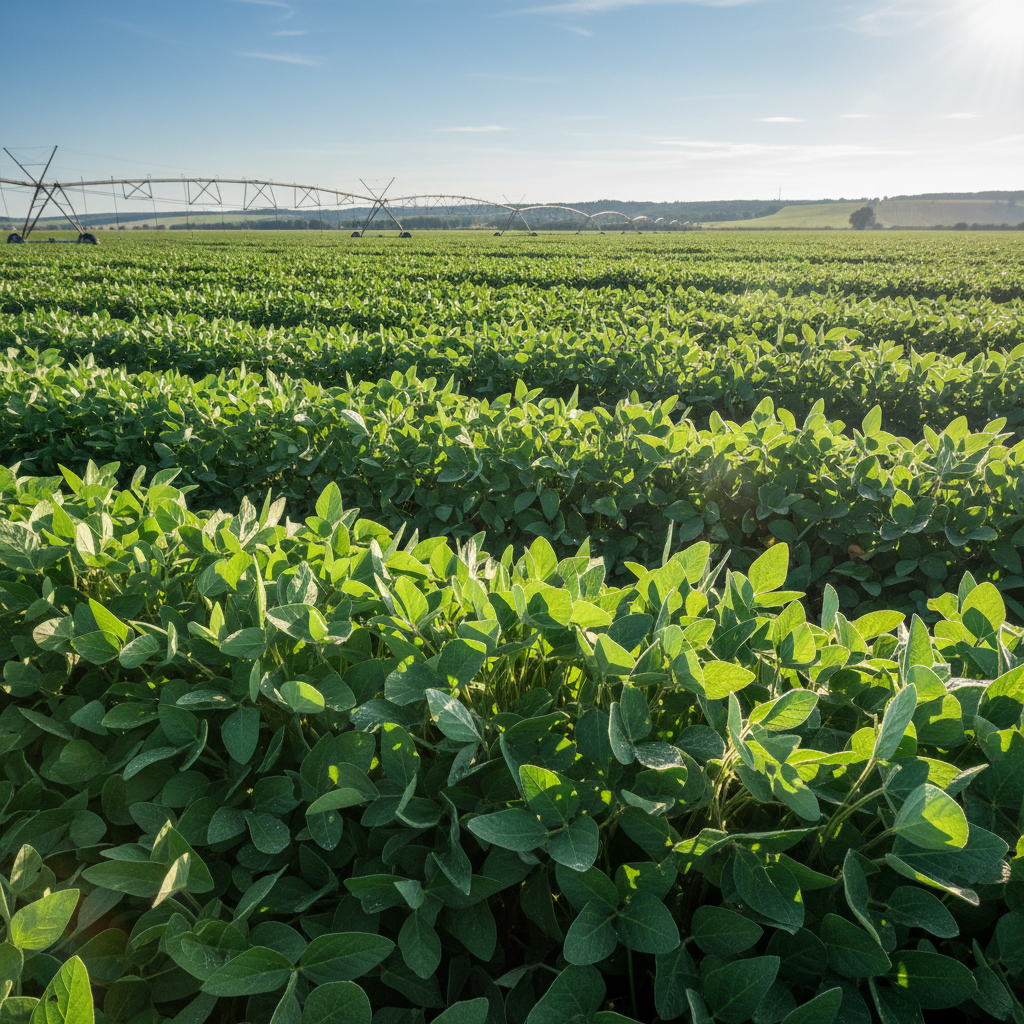
Soybeans · Illinois
Cause — What the satellite saw
Near-infrared band detected anomalous reflectance along the eastern 80 acres of Field 12 — soybean aphid pressure confirmed at 1,200 aphids per plant.
Movement — What the grower did
Targeted aerial application on 80 acres instead of treating the full 620-acre field. Application timed to peak aphid vulnerability window.
Result
$31,500
in unnecessary chemical costs avoided
Numbers that
don't need translating.
These aren't projections. Every figure below comes from documented grower accounts — real fields, real seasons, real margins.
11.2M
Acres monitored
across 6 major row-crop states
$340M+
In prevented losses
documented across active accounts
94%
Anomaly detection rate
vs. 61% industry benchmark
18 days
Average early-warning lead
before visible field symptoms
48h
First scan delivery
from pin-drop to imagery in your inbox
3.2×
Average ROI
first-season return on subscription cost
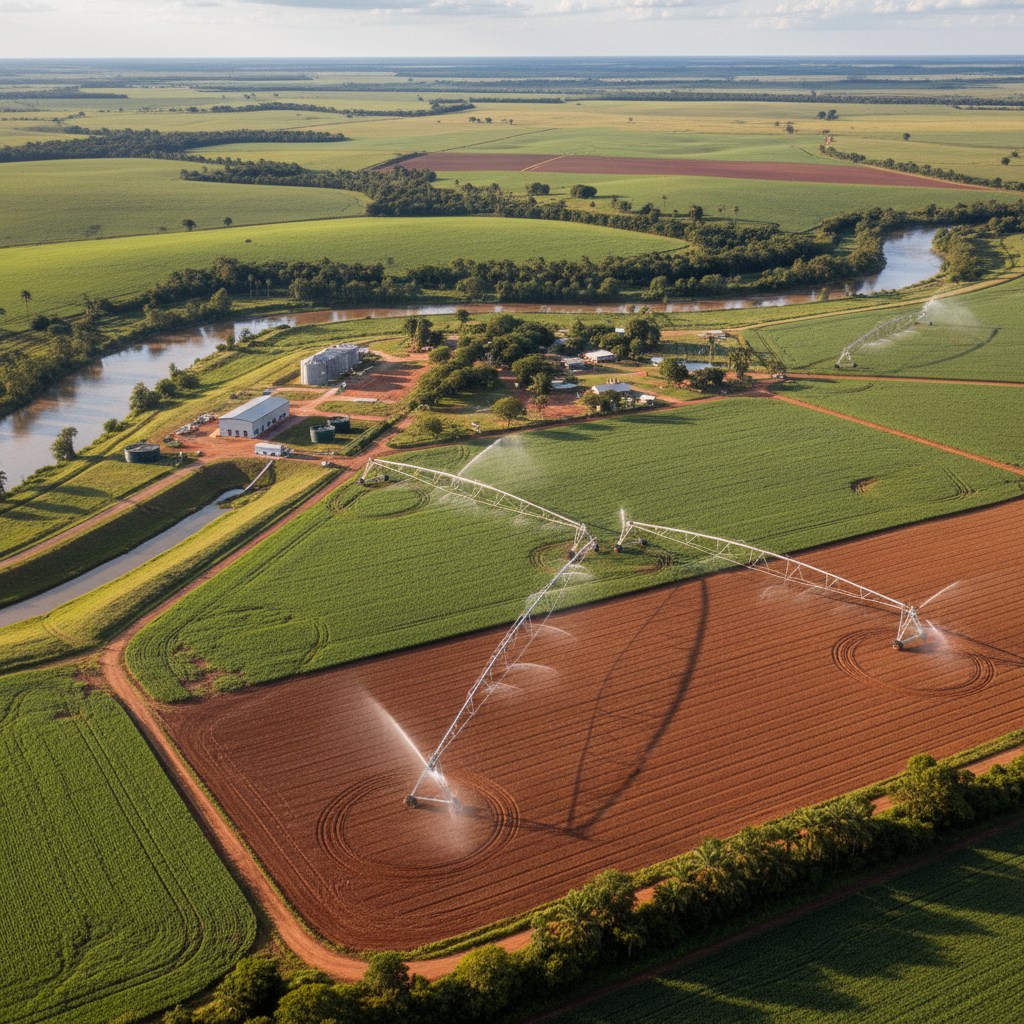
Free first scan — no credit card
Drop a pin. Select your crop.
Receive your scan in 48 hours.
No form on this page. The button takes you to a two-minute setup: pin your farm, select crop type, and Canopy delivers your first multi-spectral field report before the week is out.
How Canopy works.
The pipeline from satellite pass to field alert takes less than 48 hours. Here's what happens between the orbit and the decision.
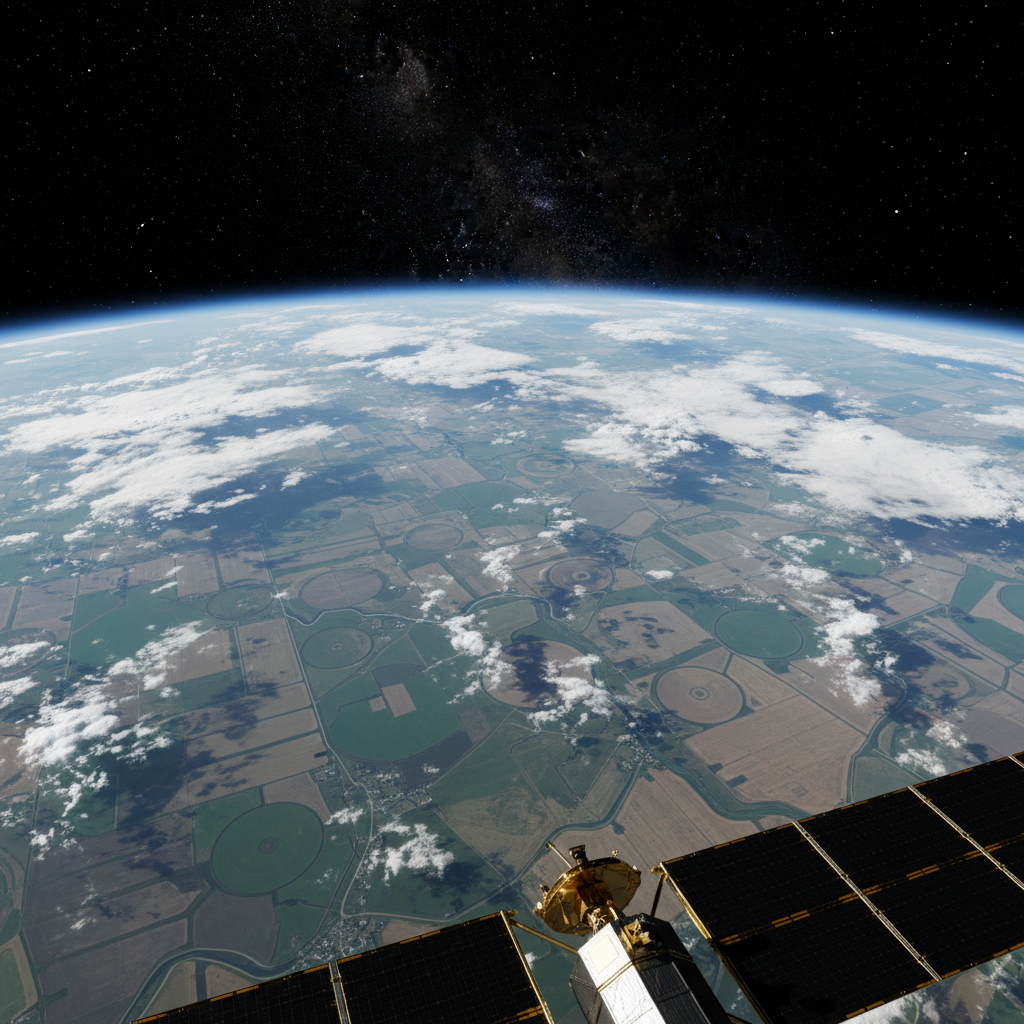
400mi
Orbit
3–5 day revisit
every field
The satellite passes overhead
Canopy's network of multispectral satellites captures your fields in visible, near-infrared, and thermal bands on a 3–5 day revisit cycle. No cloud gap longer than 7 days goes unresolved.
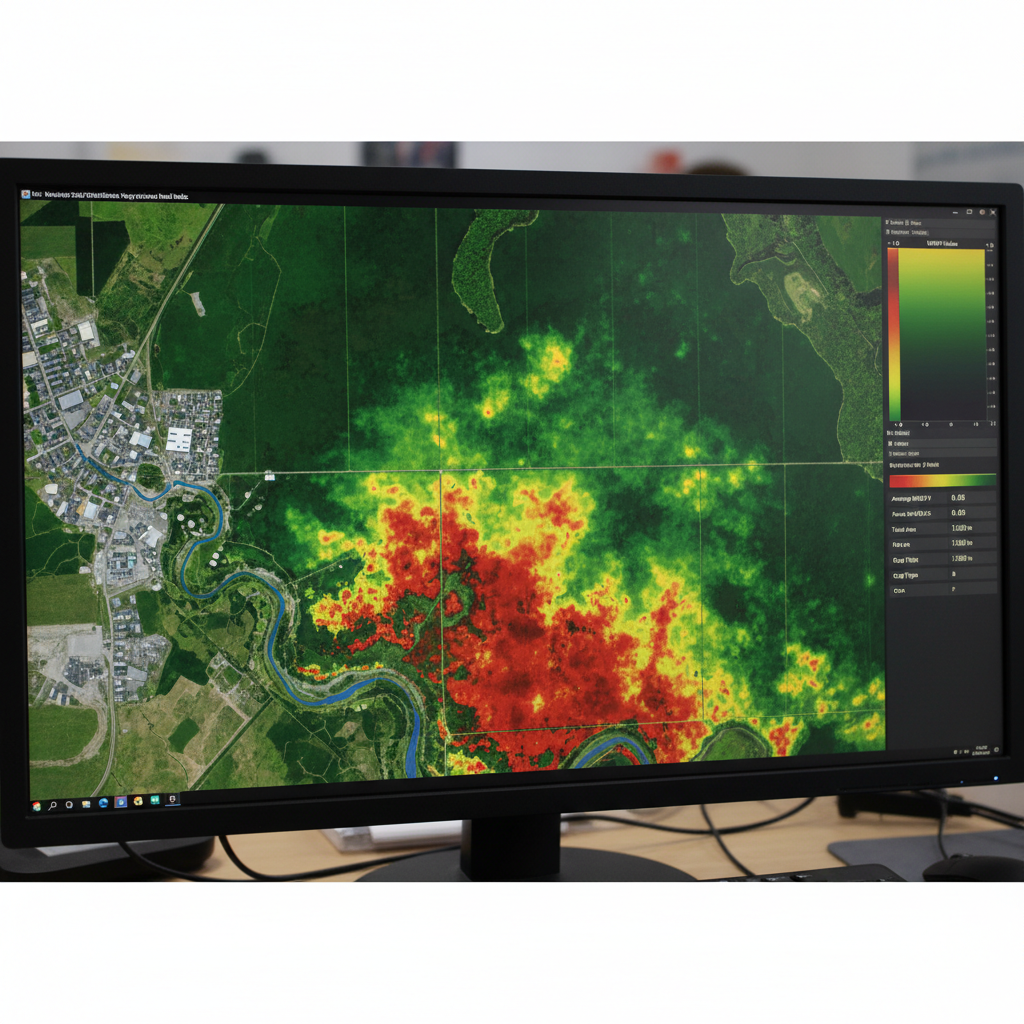
48h
Analysis
14 spectral indices
computed per acre
Algorithms find what eyes miss
NDVI, thermal anomaly, and soil moisture indices are computed for every acre. Machine learning flags deviations — not just from field averages, but from historical baselines for that crop, that soil type, and that week of season.
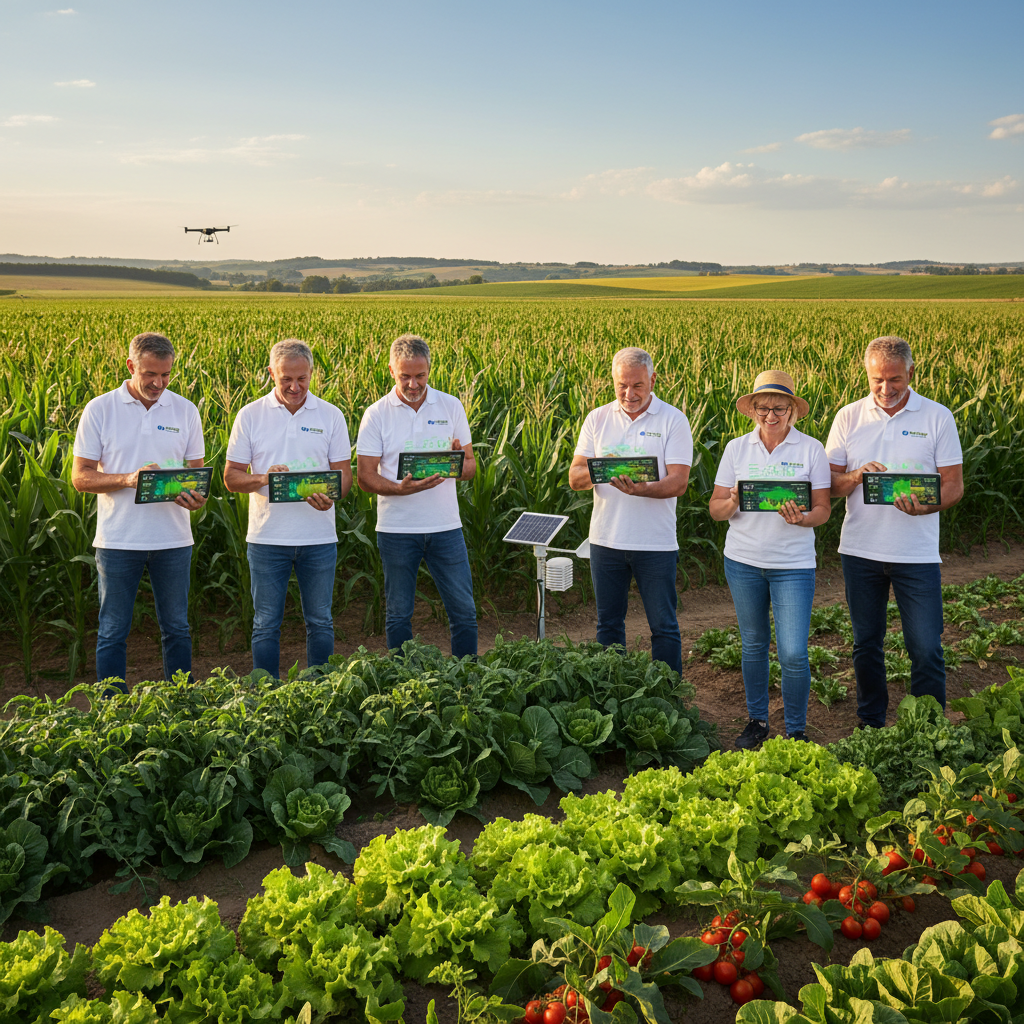
Field
Action
Geo-tagged alerts
tablet & mobile ready
Intelligence lands in your cab
Alerts arrive as geo-tagged reports — readable on a tablet at the tailgate. Each flagged zone includes coordinates, severity score, recommended action, and links to local agronomist contacts if you want boots on the ground.
Stop walking fields
you could be seeing from orbit.
Drop a pin on your operation, select your crop type, and receive your first multi-spectral field scan within 48 hours. The first scan is free — always. No form on this page.
Scout Your Fields Free